VSync basically blocks program execution until the monitor is ready to take your next GPU frame. That is the case in DX9, that is also why most PC “pro” gamers tend to avoid it, it adds latency to your input, which usually works in the same thread as the renderer. I’m not sure about DX11, I think it works similar, that is, the GPU driver waits your monitor scanline to go to the last line in the bottom and then consumes the frame you pass. You can easily check that if you turn on the Urho3D profiler, most time spent will be in Present.
You can fix that if you set engine FPS limit to 60 (or your monitor refresh rate), it will call ApplyFramerateLimit() on every frame, which will relax your CPU. I do that in my app with DX9, GL3 on linux and GLES on ARM devices.
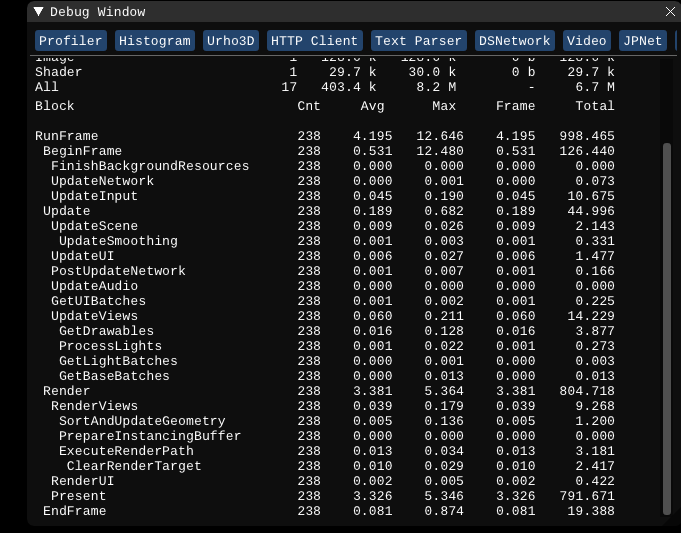
No framerate limit:
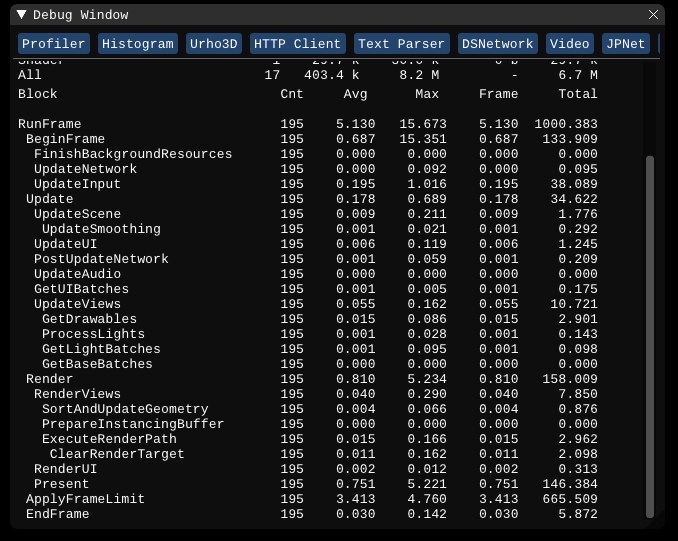
Framerate limit:
Notice Total time spent in Present when no framerate limit is applied is almost 800ms, that is 80% of the CPU time.