QBkGames
Archive 17/01/2023.
Profiler [BUG?]


Leith
The UI render time also considers the cost of the debug UI, being rendered per frame. I can’t begin to interpret the UI render time, but I can stop it happening by only drawing what I need, and avoiding complex UI elements like graphs.
QBkGames
The profiler shown in this thread: Profiler rework and profiling tool has more realistic values, 0.48 ms for UI rendering and 11.9 ms for applying frame limiting.
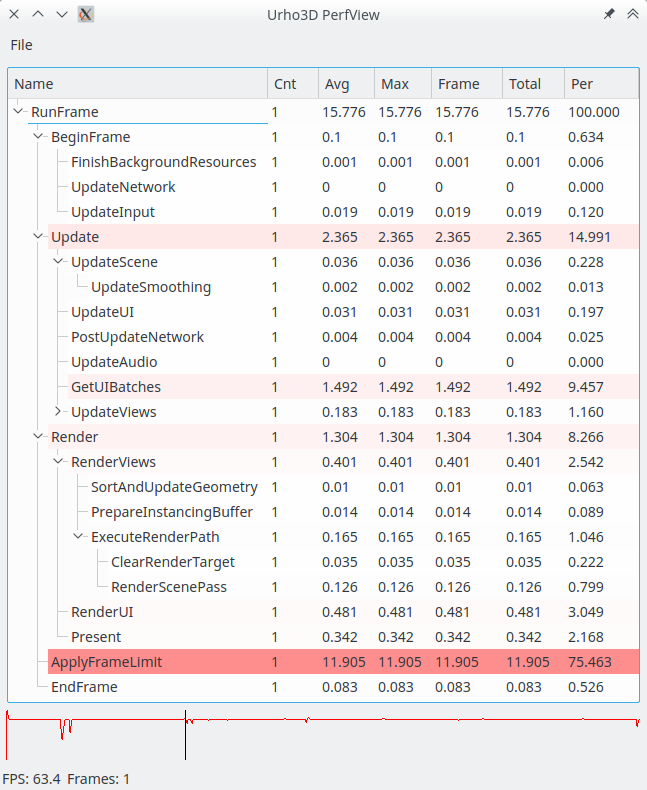
That’s what the Urho profiler should show.

weitjong
Have you narrowed it down to what could be the cause of the difference?
QBkGames
I figured out the problem, it looks like if you set the VSync flag on, the ApplyFrameLimit profiling always shows 0. Which is technically correct, however in practice it’s not very useful, since you want to see how much spare frame time you have left before the frame is presented.
IMO a more useful metric would be if the ApplyFrameLimit, was called something like “FrameSpareTime” and it started measuring the time just before the call to Graphics::EndFrame. So, if I have a game that I want to run at 60fps, and I want to know how much spare frame time I have to determine if it’s worth my trouble to be spending weeks/months implementing some extra effects. If I only have 2 ms left, I might not bother but if I have a spare 10 ms left then I can definitely try to do more with it.
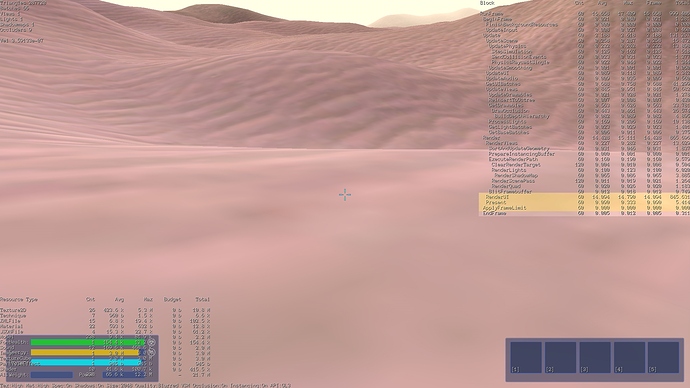
Looking that my sample above, I’m quite sure that my frame only takes about 2-3 ms to update/render (including the UI), and about 14 ms is spare time, but the Profiler is not showing me that.
QBkGames
You can still think of V-Sync as applying a frame limit, it’s just done by the graphics hardware rather than by the engine, so that timing should still be profiled separately, it just feels wrong to show it under the UI Render timing (as it’s not really UI render time, it’s something else).

Sinoid
@Leith, having written both official and homebrew Nintendo 3ds ports of Urho3D, I assert that everything you’ve said is false on even the tightly resource constrained 3ds platform and thus as false can be.
This is likely an instrumenting error. Because of how Urho batches 2d UI drawing it’s almost inconceivable that 2d drawing would be a real issue. Possibly some compatibility triggers or the user named his output file poorly and his video drivers are doing some nonsense for an exe they think is Doom3 or such.
Regardless, he’s getting different timings out of different instrumenting methods. That indicates the instruments have issues.